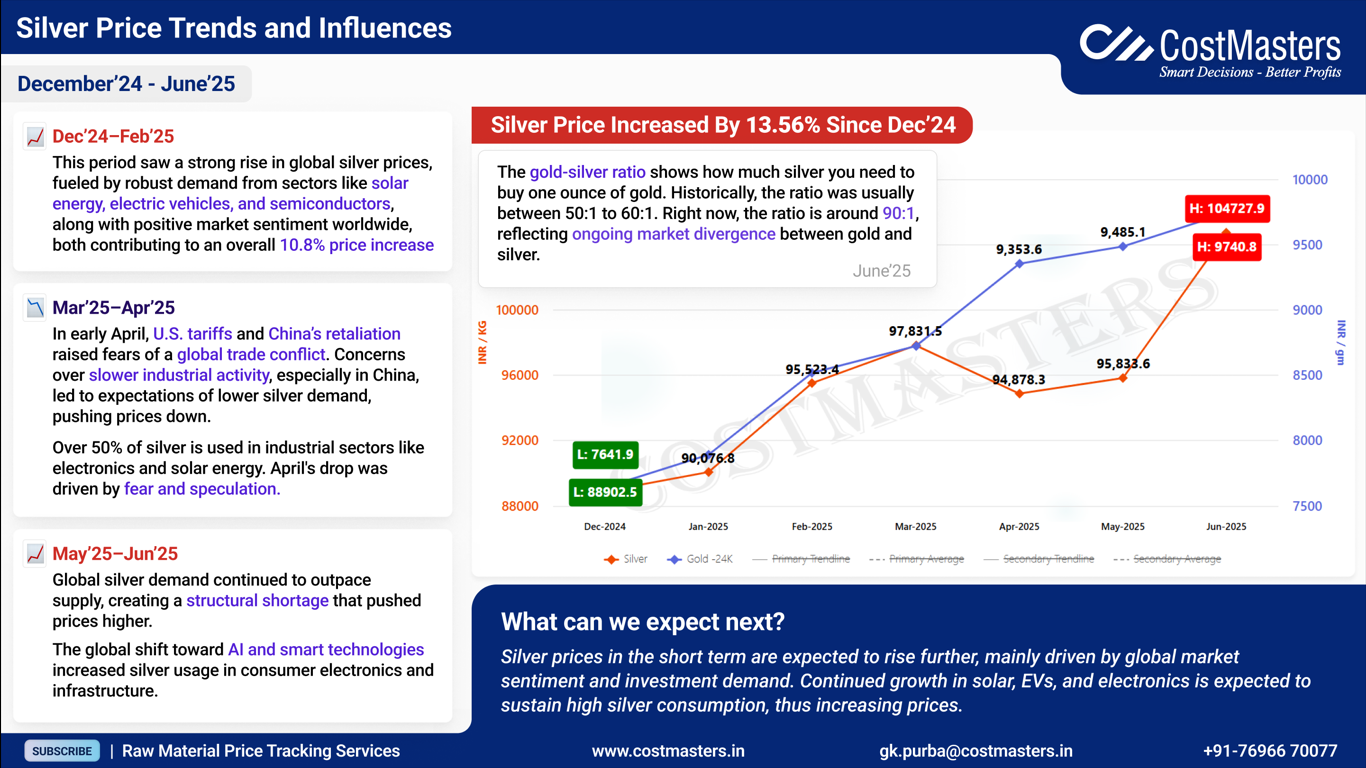
Dec’24 – Feb’25
This period saw a strong rise in global silver prices, fueled by robust demand from sectors like:
- Solar energy,
- Electric vehicles, and
- Semiconductors,
along with positive market sentiment worldwide, contributing to an overall 🔺10.8% price increase.
Mar’25 – Apr’25
In early April, U.S. tariffs and China’s retaliation raised fears of a global trade conflict.
Concerns over slower industrial activity, especially in China, led to expectations of lower silver demand, pushing prices down.
Over 50% of silver is used in industrial sectors like electronics and solar energy.
April’s drop was driven by fear and speculation.
May’25 – Jun’25
Global silver demand continued to outpace supply, creating a structural shortage that pushed prices higher.
The global shift toward AI and smart technologies increased silver usage in consumer electronics and infrastructure.
Silver Price Increased By 13.56% Since Dec’24
The gold-silver ratio shows how much silver you need to buy one ounce of gold. Historically between 50:1 to 60:1.
Currently at around 90:1, reflecting ongoing market divergence between gold and silver.
Price Chart Highlights (Silver & Gold)
- Silver Price (INR/kg):
- Low: ₹76,419.9 (Dec 2024)
- High: ₹104,727.9 (Jun 2025)
- Gold Price (INR/10g):
- Low: ₹88,902.5 (Dec 2024)
- High: ₹9,740.8 (Jun 2025)
What can we expect next?
Silver prices in the short term are expected to rise further, mainly driven by global market sentiment and investment demand.
Continued growth in solar, EVs, and electronics is expected to sustain high silver consumption, thus increasing prices.